
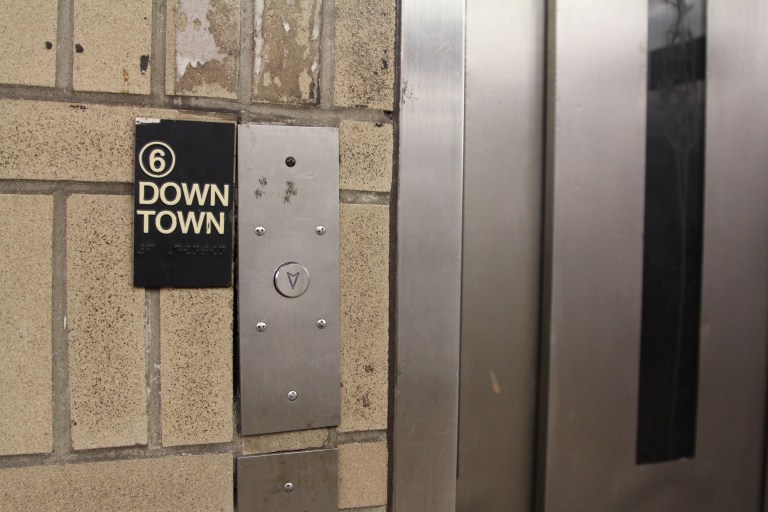
In snowbound New York back in March, while looking at a rooftop across the street I found myself thinking about “desire paths” and the environments and contexts across which they reveal themselves. While desire paths are made primarily with one’s feet (and therefore upon the ground), there are many other kinds of desires paths (although there’s a brilliant repository of the primarily foot-based variety here, for those interested). You’ve probably seen these other desire paths inscribed upon the “close door” button of an elevator, or a patina upon the rightmost of a pair of door handles. Basically, a desire path is the visual expression of an enacted desire.
In the parlance of international development and other fields, there is a separate but related term: “positive deviancy”. Positive deviants are those who, despite having similar or fewer resources than others in the community, display behaviors that increase or protect their wellbeing or wealth. Such “positive deviants” – the individuals in a group “whose uncommon but successful behaviors or strategies enable them to find better solutions to a problem than their peers, despite facing similar challenges and having no extra resources or knowledge than their peers.” They are those who are working against the oppressive sameness of daily life, trying the untried and breaking the tyranny of routine (and not always by choice, as with the original case that inspired “positive deviance”).
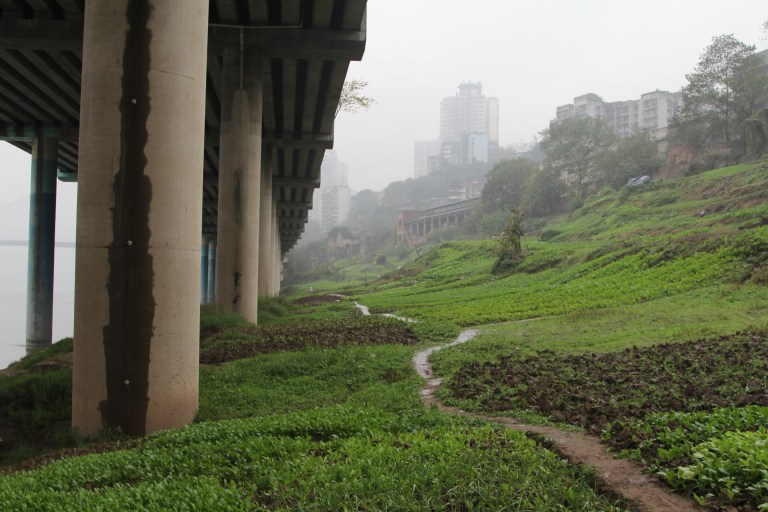
In urban planning, a “desire path” arises from the combined effect of cumulative footfalls of individuals as they travel over a surface that both a) lacks a “formal” (that is, paved or otherwise affording foot traffic through preventing wear) path, and b) reflects over time the passage of pedestrians through a change in physical appearance. For example, one becomes acutely aware of desire paths after a fresh snowfall, when any deviations from the obscured walkways beneath said snow are clearly reflected by pedestrians’ passing footprints. I like to think of the ethnographic method as that blanket of fresh snow – a lens through which interesting human behaviors reveal themselves for deeper exploring. Seen in this way, behaviors contain the potential for influencing the others by showing them a path or behavior they didn’t previously consider or think possible.
This act of searching for positive deviance within a population is what fascinates me. How do you find these interesting behaviors to unlock and understand their roots? The catch with the metaphor of “snowy” desire paths is that they are visible to even the most casual observer. What if one is searching for, say, behaviors that point towards new ways to design street-level infrastructure?
The right perspective is key; upon encountering someone in the act of an interesting non-standard behavior, one’s reaction will vary depending upon the frame one happens to be using at the time. Someone familiar with ethnographic methods might consider such a behavior worth understanding in greater depth. Tom Hulme, formerly of IDEO, spoke of seeking out such behavioral “desire paths” as a metaphor for the need-finding stage of the design process. With the right perspective, someone sitting upon a pile of police barricades isn’t just acting upon their fatigued feeling – they’re perceiving an affordance that was unanticipated by the object’s designer, something that wasn’t there before to anyone else. So too with the person who places their belongings on a sidewalk’s standpipe – while not designed for that purpose, standpipes afford the momentary storage of one’s belongings.

This is where the qualitative ethnographic method could benefit from a dose of quantitative know-how. In searching for interesting street-level behaviors, understanding where the greatest concentrations of the sorts of people in whom you are most interested would be valuable. Municipal datasets, GIS data, and even Google Maps can reveal demographic data, the presence of sidewalks and public spaces, and, by extension, the richest areas to center research. As Jan Gehl wrote in his seminal text, “How to Study Public Life”, “Making a qualitative assessment by counting how many people do something makes it possible to measure what might otherwise seem ephemeral: city life… The question of how many or how few comes in several varieties in public life studies, such as before and after urban improvement projects.”
As cities are driven to become increasingly “smart”, it is easy to simply listen to the advice see solely through the frame of those who rely entirely upon analytics, rather than asking questions like “What is smart?”, and “For whom is the city becoming smarter?”, striving to understand more deeply both the usefulness and the fairness of such a process for citizens. In his book “Against the Smart City”, urbanist and designer Adam Greenfield identifies the goal of these merchants of “smartness” as, “[making] every unfolding process of the city visible to those charged with its management; [rendering] the previously opaque or indeterminate not merely knowable but actionable; and ultimately, to permit the “optimization” of all the flows of matter, energy and information that constitute a great urban place.”
The Ciscos, IBMs, and Siemens of the world would like you to believe that there can be a universal urban API of sorts, apparently not aware that this would mean relegating citizens and the urban services they rely upon to the sorts of behavior that programmers typically reserve for lines of code and link libraries – things that prioritize speed above all other things, that behave uniformly, and that approach all situations with the same (knowable and predictable) perspectives.
This methodology must be tempered by ethnographic and qualitative methods. There must be an analysis of the banalities of “daily life” to understand the directions to advance the cities of tomorrow, which feeds into the larger dialogue of making things meaningfully “smarter”, rather than simply infusing each aspect of daily life with sensors and technology.

This is easier said than done, however, and it speaks to the sometimes massive difference in approaches to the question of what makes a good [urban] life. The Big data frame, with its predilection for all things “sense-able”, often looks to simply toss away “outliers” of human behavior, rather than seek to understand why they came to be that way. This points to why the approach Jan Gehl outlines in his foundational textbook “How to Study Public Life” A/B testing things like an urban environment produces superbly well-supported data that reveals which urban layout attracted and was used by more people of a particular gender, age range, or group size. Using behavioral mapping supported by deductive content analysis, observations may be made about the daily life activities that unfold in that area: “broadly speaking, the primary activities in public space are walking, standing, sitting and playing…In general, public space activities can be divided into two categories: necessary and optional.”
With the output from these observations and analyses, one could even make claims around which element of public infrastructure was more “usable” or “inviting” to citizens. The risk of all these answerable questions is that they can be mistaken for being all of the questions that one could possibly ask about how a city is used. These data-supported questions, grounded in perfectly sound methodology, supported by concrete numbers gathered by researchers or sensors, would not in themselves be able to answer why people did something.
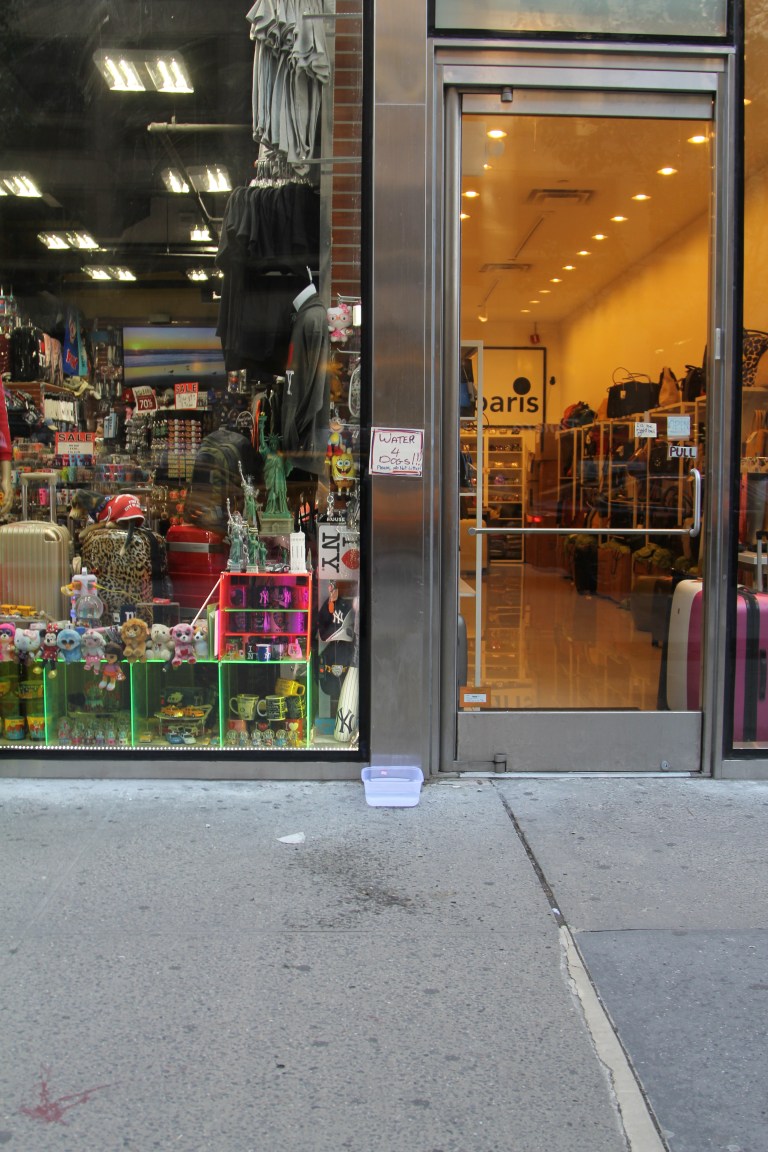
Why leave a bowl of water out for dogs at this particular location – a crowded sidewalk in New York City? Why have a receptacle for receipts as part of an effort to support elderly and disabled individuals – in a back alley of Taibei, Taiwan? In both cases, consider the level of trust necessary for this – why do both of these things work here? Why trust that the water is clean, or that the receipts are actually going where the donation box claims? What makes these things work? We can count them, but ethnography will allow us to understand them.

Ethnography is one of the most promising avenues for framing and understanding interesting behaviors. There may be value in some cases in seeing an individual as a logical line of code in an “urban API”, or coding someone recorded in an observation as “playing” in a park (or carrying out an “unnecessary” activity). Such frames might surface data that could lead to creating a more pleasant urban environ or piece of infrastructure. However, these two frames of analysis are seldom kind to outliers. Their perspective does not seek “desire paths” so much as find out where the masses are going and attempt to increase the quality of their experience incrementally. Through observing people’s behaviors on an individual basis, by looking not only at the paths and choices of the masses but studying the positive deviants, one can follow a set footprints off in a direction that calculated iteration and incremental nudges would never be able to point one towards.